Season Descent — The Terrain IS the Season
A 3D terrain visualization where the landscape itself is a living document of the NWSL season. The terrain evolves week by week as real matches happen. Teams are marbles rolling on the surface — better teams have stronger gravity and descend deeper.
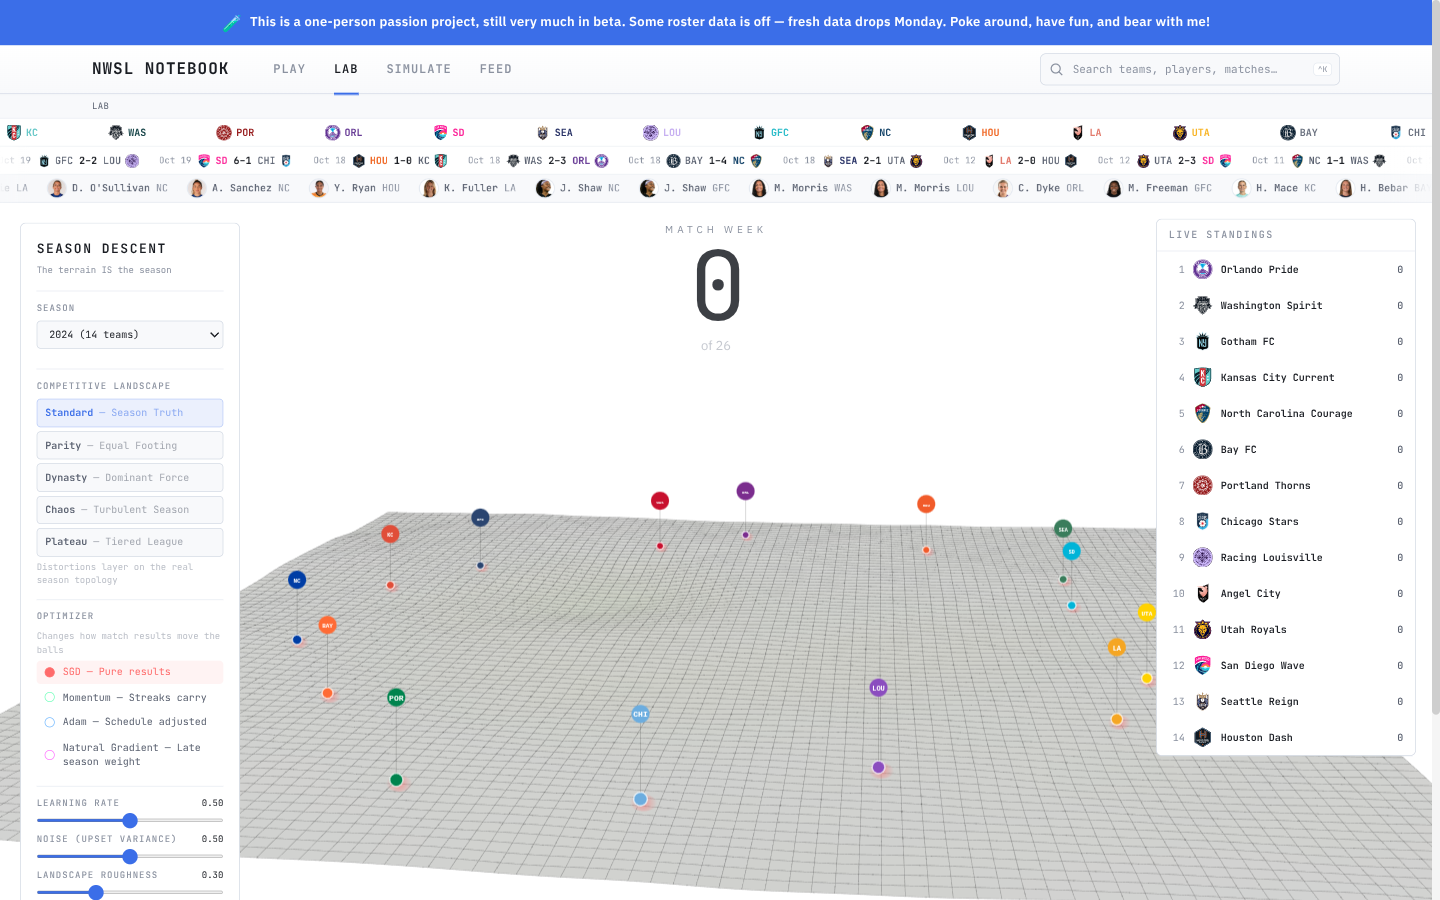
The Core Idea
Most standings tables show you where teams ended up. Season Descent shows you how they got there. The terrain is sculpted by match results — wins carve valleys, losses build ridges — so the final landscape is the geological record of everything that happened in a season. The shield winner descends deepest. The bottom team sits on a plateau.
This is a gradient descent metaphor made literal. Each team is an optimizer navigating the same loss landscape, but with different learning rates (gravity) determined by their actual quality. The sliders let you change the physics and ask “what if?”
How the Terrain Forms
The terrain starts nearly flat at week 1 and is progressively carved by match results:
Each win carves a valley beneath the winning team. More wins = deeper valley. Draws create shallow depressions. Losses push small bumps into the surface.
Each match result leaves a permanent imprint on the terrain at the team's current position. Over a season, these imprints accumulate into the characteristic channels and plateaus of the final landscape.
Five competitive landscape presets distort the base terrain to explore different scenarios: Standard (real season data), Parity (equal footing), Dynasty (dominant force), Chaos (turbulent), and Plateau (tiered league). These layer on top of the actual results.
Teams as Marbles
The terrain is the same for all teams. What differs is each team's gravity — their ability to descend:
- --High PPG teams feel slopes intensely and descend fast into valleys
- --Low PPG teams barely respond to gradients and sit on plateaus
- --No external kicks or pulls — marbles only respond to the terrain gradient plus noise
- --By season end, depth directly reflects points. The shield winner is deepest. The bottom team is highest.
Optimizer Modes
The optimizer controls how match results translate into marble movement. Each mode applies a different update rule — borrowed from machine learning optimization theory — to the marble's velocity:
Simple gradient following. Marbles respond directly to the local slope with some noise. The baseline — no momentum, no acceleration tricks.
Winning streaks build velocity. A team on a hot streak accelerates downhill; a losing team decelerates. Captures the “form is temporary” dynamic of real soccer.
Adaptive learning rates. Each marble maintains running averages of gradients and squared gradients, adapting its step size automatically. Teams that encounter consistent gradients (stable form) move efficiently; teams in noisy terrain (volatile results) take smaller, cautious steps.
The Sliders — “What If?”
The sliders change the physics of the simulation, not the terrain itself. Default positions produce outcomes close to real standings. Moving them creates alternate histories:
Data Behind the Visualization
Season Descent is built from real match data. The terrain carving uses actual points-per-game values and match results from the NWSL event database. Historical seasons (2016–2025) use completed data; the current season updates as matches are played.
The gradient descent metaphor is not decorative — it's structurally accurate. The terrain IS the season's competitive landscape, constituted by match results rather than existing prior to them. The optimizer's epistemology (team quality) shapes the ontology of what is learned (final position). You can't predict the path without running it — computational irreducibility made visible.
Pick a season, adjust the physics, and watch the terrain unfold.