Data Sources
Where the numbers come from, what they cover, and how fresh they are.
Event Data
SPADL-converted event data covering every on-ball action — passes, carries, shots, tackles, interceptions, clearances, fouls, take-ons, crosses — for every NWSL match. The SPADL format (Soccer Player Action Description Language) standardizes event data from multiple providers into a unified action-based representation, making cross-season and cross-provider comparisons consistent.
Match & Schedule Data
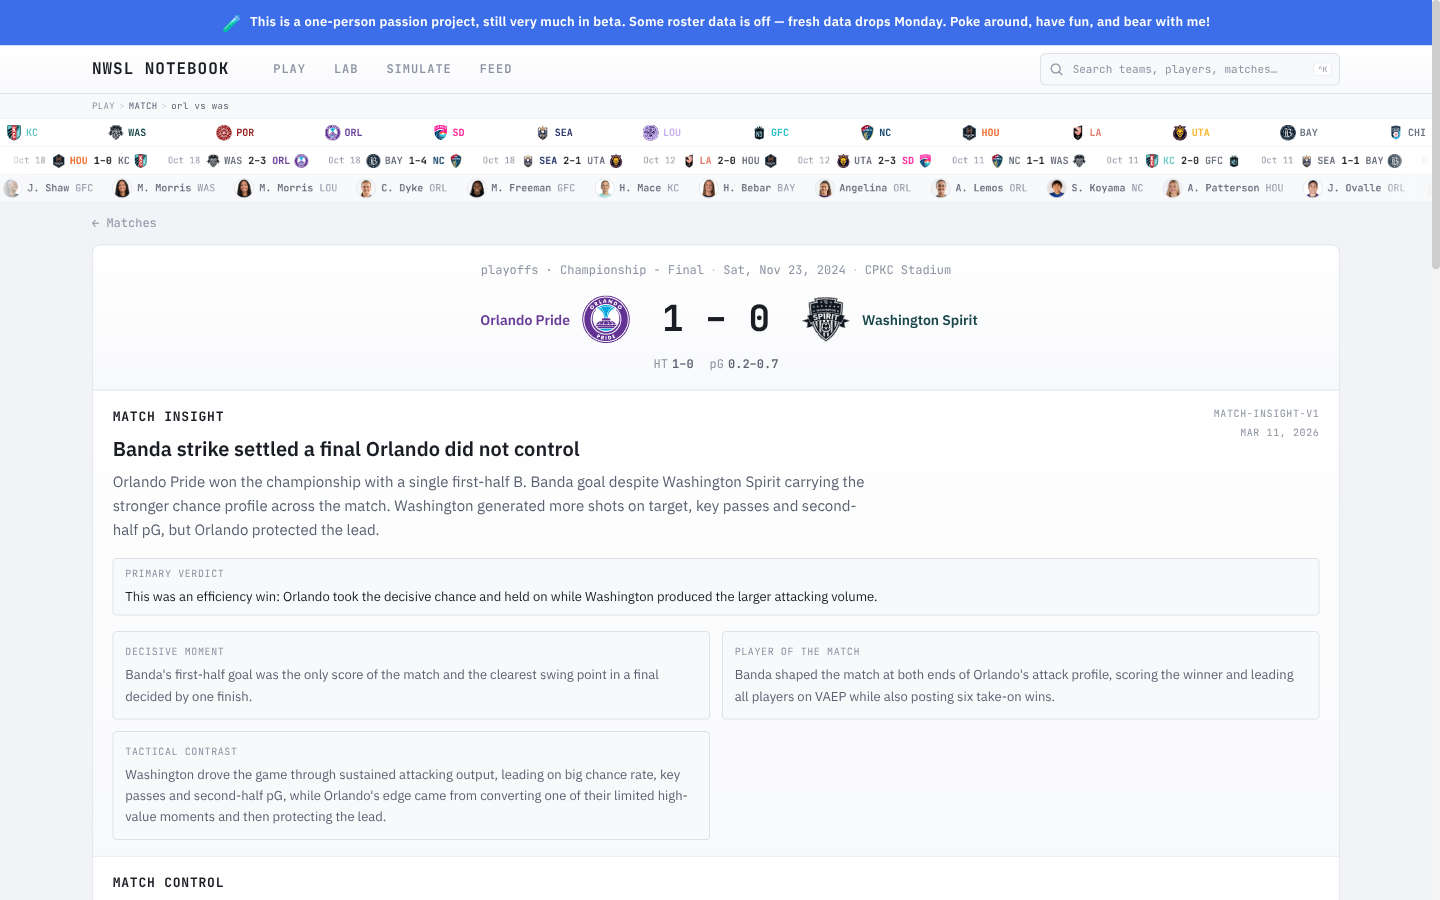
Complete fixture records including final scores, half-time scores, venues, attendance figures, match week numbers, and competition stage. Covers regular season and playoff matches.
Player & Team Data
Player profiles including name, position, nationality, birth date, height, dominant foot, headshots, and jersey numbers. Team metadata including official names, short names, codes, and logos. Season rosters with appearances and goals.
Derived Analytics
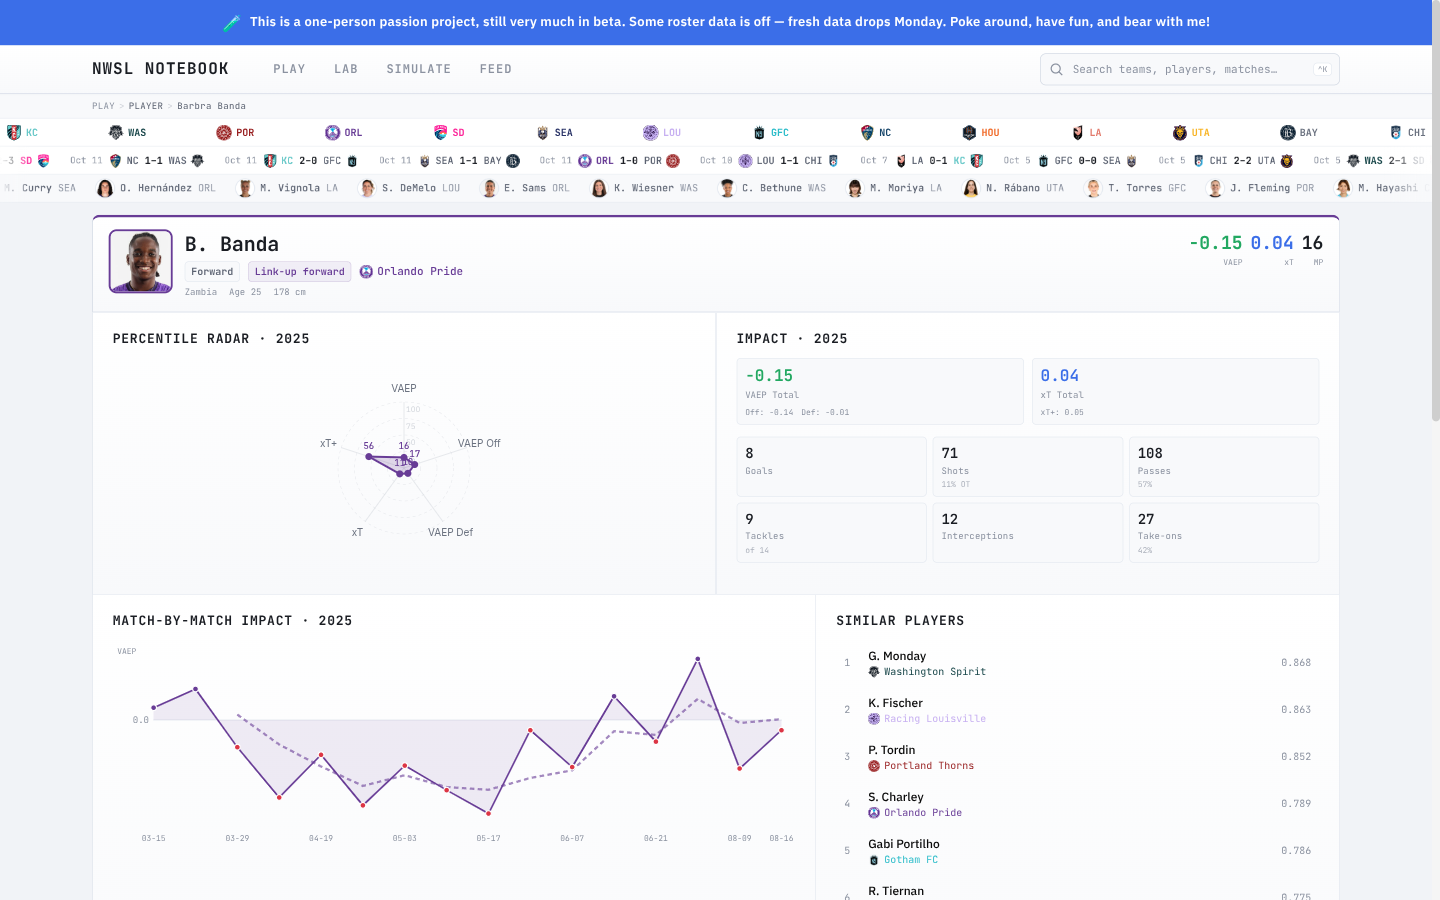
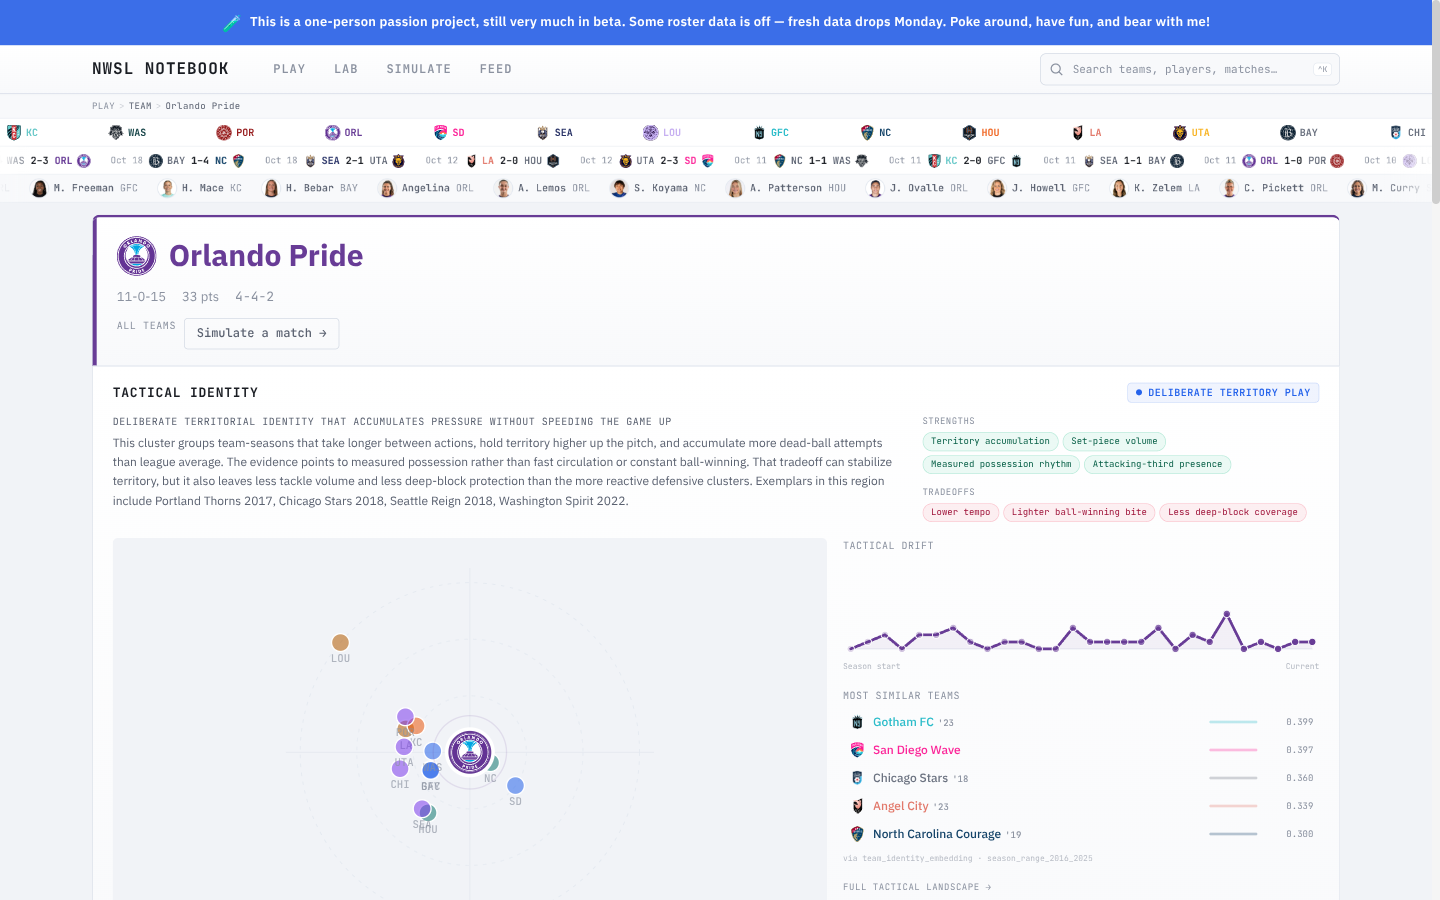
Raw event data is transformed into higher-order metrics and models:
Coverage
| Seasons | 2016 – 2025 (2026 in progress) |
| Matches | ~1,200+ regular season + playoffs |
| Actions | ~3M+ on-ball events |
| Players | ~1,500+ |
| Teams | All NWSL franchises |
Data Freshness
Data pipelines run after each match week. The analytics database is populated by a separate pipeline system that processes raw event feeds, computes derived metrics, trains embedding models, and generates AI narratives. Some roster data and newer season data may lag — consistent with the beta nature of the project.