About NWSL Notebook
NWSL Notebook is a one-person passion project built on a simple premise: the National Women's Soccer League deserves the same analytical depth as any top league in the world. Every team profile, player ranking, match simulation, and tactical insight on this site is computed from real event-level data — no guesswork, no vibes-only takes.
The NWSL lacks the infrastructure to publicize player performance data the way men's leagues do. NWSL Notebook fills that gap. By making players visible — their contributions quantified, their styles mapped, their trajectories tracked — it facilitates the fan relationships and league growth the NWSL needs. The site is free, open, and in beta.
The Four Stations
The site is organized into four stations, each representing a different epistemic relationship to the data.
The game as it is. League standings, team profiles, player rankings, and recent match results.
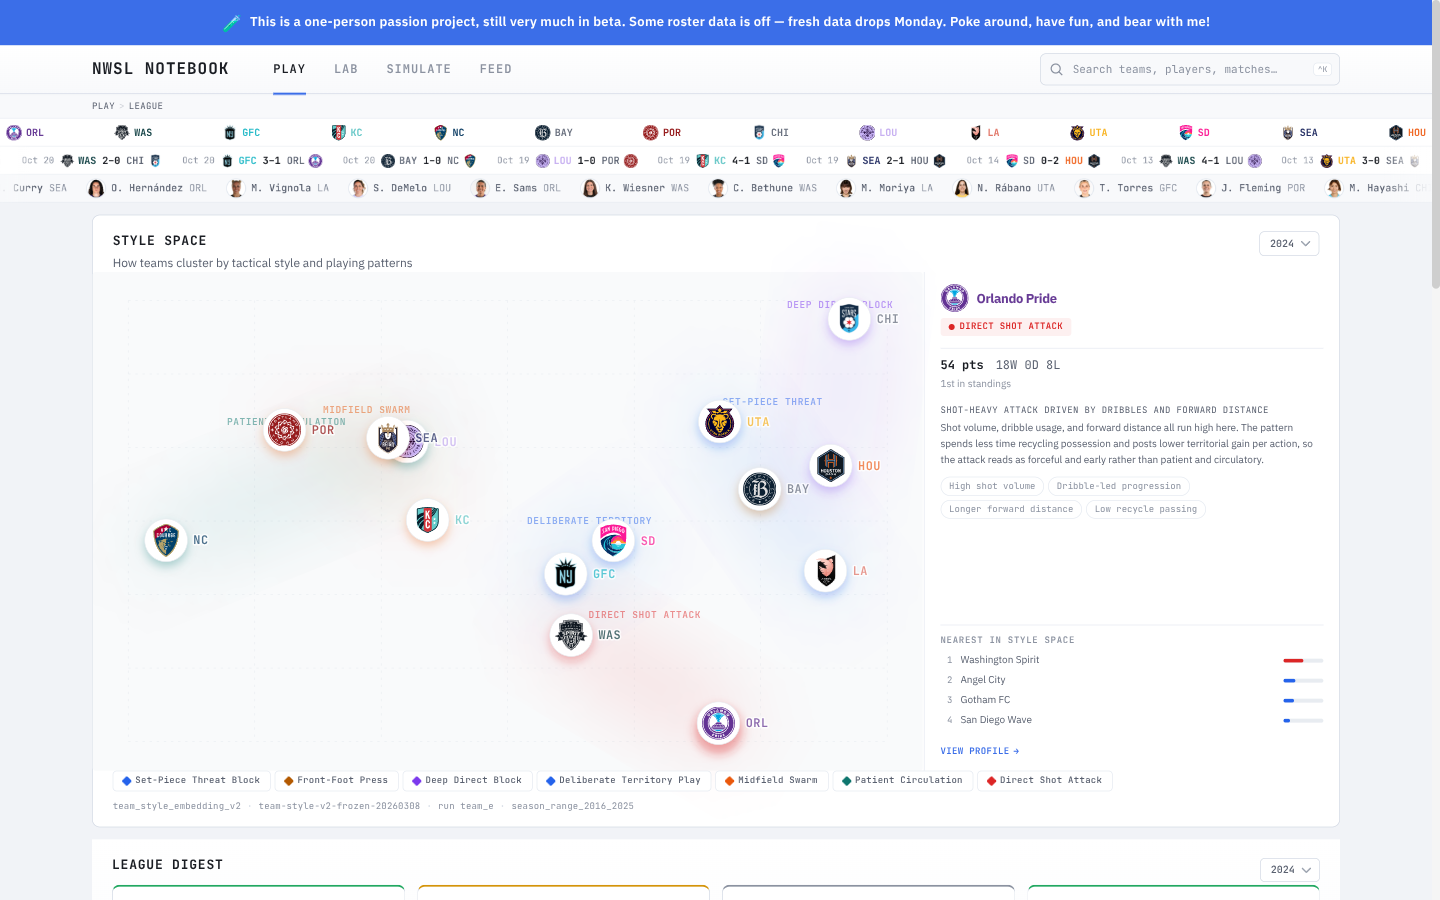
Interrogate what you see. Season Descent terrain visualization, style embedding maps, archetype clustering.
How Season Descent works →What could be. EVE-1, an event-level transformer, generates full match simulations pass by pass, shot by shot.
How EVE-1 works →The living pulse. Oracle-1 watches the analytics database and publishes what it finds noteworthy — patterns, anomalies, and shifts as the season unfolds.
How Oracle-1 works →What's Under the Hood
- Event-level data for every NWSL match since 2016
- VAEP (socceraction framework) for action valuation
- Expected Threat (xT) grids for spatial value
- Team and player style embeddings with GMM clustering
- CASLO signal framework for behavioral tracking
- EVE-1 event-level transformer for generative match simulation
- AI-generated match narratives and team briefings
See Metrics & Methodology for full details. See Season Descent for the terrain visualization. See EVE-1 for the simulation engine. See Data Sources for coverage.
Credits & Acknowledgments
- socceraction (Tom Decroos et al., KU Leuven) for the VAEP framework
- Karun Singh for the expected threat methodology
- The NWSL and its data providers
- Next.js, Tailwind, Radix UI, TanStack Query, Vitest
Contact
NWSL Notebook is built and maintained by one person. If you find bugs, have ideas, or just want to talk soccer analytics, reach out.